My project

So here’s a link to look over my project,

https://docs.google.com/presentation/d/15UeAG9KL1vOaZVAMdJJ4skERxn23X1coCYhSS2zWc2c/pub?start=false&loop=false&delayms=3000

I know I went over most of my project during class, but I figured I’d post this anyway so people can see it.

One thing that I didn’t really get a chance to talk about was my experiences with textstat (which I thought was much more useful in doing a close reading then voyant). While it took a while for textstat to work since I had to run it through python, textstat definitely helped me find themes that may have been harder to find or see in voyant.

However, voyant allowed me to make much prettier visualizations, even though many of their tools did not work at all.

Half way through I switched to google graphs because it allowed me to manipulate and create graphs with information i found on textstat. Voyant was very finicky about what information I could look up. For example, when looking for the word love, I was able to get the counts for related words (loves, lover, lovers), while in voyant I can only get the frequency for one word at a time.

I had a lot of fun doing this. I was able to play with the themes of a book that I truly loved. It was interesting seeing what I can do with the concordance tools and use them to prove or disprove my hypothesis.
Python and Text Stat

So, I haven’t been able to use textStat because I have a mac and you need to run python on the mac to make TextStat run. The minute I read that on the website, I was like “ha! that’s not happening, I don’t even know what a python is.”

So here I am doing this literary analysis and there is only so much Voyant and do…so I downloaded textstat, and found direction, through google (yay for google) of how to run textstat through python on a mac, I think that was the actual website name.

So here I am, on my terminal window (I learned about that during my spring break coding extravaganza! so exciting!) trying to make my computer do what I want it to do… and I type in commands, copy and paste things, and take a deep breathe, and hit enter.

and Absolutely nothing happens. What a disappointment. I try again, nothing. I go back to the website make sure I didn’t mistype anything, and still nothing. I go to github (again something I learned during spring break, I can’t wait for the semester to end to really get back into it) and they are of no help (granted I didn’t spend much time looking).

What do I do? I right click TextStat, and select the open with  python option….and presto, it works….sigh….I least I didn’t spend hours trying to figure it out through the terminal commands, even though I will eventually try and open textStat through terminal one day!

cd ‘/Users/arianarodriguez/Downloads/TextSTAT-2-1/’ && ‘/usr/bin/pythonw’  ‘/Users/arianarodriguez/Downloads/TextSTAT-2-1/TextSTAT.pyw’ (this was the actual command I needed to know…duh!)

Voyant part 2

So we have all played with Voyant. However, a couple of weeks ago they updated the system and released Voyeur 3.0. With this version there are also voyant tools, which are graphs that depict the various forms of data that Voyant analyses. Most of the graphs are different ways to see word frequencies.

1st problem:

The Tools, as cool as they are run on Java, and for some sort of compatibility issues, do not run on the Google Chrome server. This of course was easily fixed and Voyeur Tools ran on Safari.

2nd Problem:

the Tools are in beta. So many of them still have bugs that are being worked out. And there are few instructions on what each graph should do, and how to make them work properly. I’ll continue working with some of them, because the graphics are cool. Hopefully they actually work.

3rd Problem:

Some things that happened almost instinctively in the older version was difficult for me to work the same way with this version. the graphing of specific word frequencies, for example,  in the older version, you would just type the word in the search bar, hit enter and they would all show up on the graph, it took me days to realize that they needed a comma between the words. I tried semi-colons, colons, hyphens, and a few other punctuations. for what ever reason comma never came to mind.

4th problem:

The directions are very basic and very difficult to navigate through. I searched through them a few times for different questions and found website itself dizzying. It takes you around in circles  and the explanation unhelpful and missing steps.

However, this is now this option to import .txt files which I think is much more convenient then the copy and paste of the older version.

I needed to vent about the changing software.

SkillShare

So like I’ve said before in another blog post I have been trying to learn how to code, use HTML, CSS, and now through SkillShare, am learning Ruby on Rails. This class has opened my eyes to the world of computers. I feel like I was terrified to experiment with coding and computer programs. I always felt like it was inaccesible honestly until now.

I still feel like building a website is insurmountable, but at the same time I am understanding the language. It is not as impenetrable as it once was. and these classes i’m taking on codeacademy, skillshare, and general assembly are SO helpful. They have become my cheat sheets into learning these languages.

I feel like the more I learn, the more I want to learn. I think the instant gratification of creating something online, seeing instant progress after each line of code makes it so much easier to continue to try and decipher these languages. I’m excited to see what else I will be able to do with these online classes.

Voyant and Tapor

So Tapor now has a new website. Instead of their “recipes” they now pictures displaying the different things you can do on Voyant. Most of the actions are repetitive and some of them don’t work properly. I’ve tried a few of them to see if/ how I can use these to work on my final project (which is some sort of text analysis of Harry Potter). You can know upload multiple texts to voyant and decide which ones you want to compare or see at any given time.

While you can see an example of how the tool will work or what it looks like, the tools themselves are not necessarily the most reliable. they sometimes work beautifully and sometimes don’t. there is little information of how to use the tools and what they are exactly supposed to measure. It’s easy enough to figure out once you play around with them.

I still am going back to the original Tapor to use the “recipes.” They are much more detailed and give ideas of how to use your texts and use the tools to analyze them.

Timeline

So after class I went and played around with timeline to see if it would be useful for my final project. It was super complicated to figure out that I had to use timelines demo spreadsheet to fill in my information. When I tried to recreate my own spreadsheet it didn’t work. The spreadsheet itself was straightforward but limited as to what I can put on it.

I was able to organize information on it well, but like Luisiana said in class, links to news pages don’t show the article you want, but the main page of the news site. If you use the permalink, once you click on the picture it will send you to the article you want.

The site is good for showing the passage of time in a very interactive way. but it does little else. It is very strict in regards to inout methods and limits what you can actually do on the site. But it sure as hell beats a static picture.

XML and oXygen

I probably should have posted this right after David Birnbaum came to class, but I’m pretty bad at keeping up with blog posts.

David was nice enough to sit with me and work on a document I was working on and helped me format it and create a valid schema for it.

He made xml look so easy, and while I know that it would have take me MUCH longer to write/create the same thing I was super happy to have him help me and lay the ground work. oXygen, once understood, was pretty intuitive, and easy to use. it just takes quite a while to learn the language.

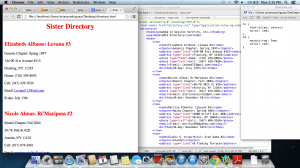
Below is a screen shot of the finished document, the xml document, and the css. Unfortunately I couldn’t open the schema file because my trial on oXygen expired.

Screen Shot 2013-04-08 at 5.26.06 PM

My Spring Break.

So I am currently unemployed, which I’m not extremely upset about because I get to really focus on school. However, like every sane person in this economy, I am looking. Through this job-finding process I have realized the extent that EVERYTHING has become digital. On almost every job post I have seen (mind you my concentration is Urban Education, so my job search is all related to that) the employers are requiring knowledge of R, html, and CSS.

Now, I know what html is, because like everyone else I use the internet. I DO NOT know what to do with it, or how it works. CSS we learned during our couple of classes on oXygen and xml, but again I only know what it is, and  vaguely understand what to do with it. R? It’s the 18th letter of the alphabet. Other then that I have no idea what it means.

So, since I had an insane amount of time this past week, and one can only do SO much yoga, I started looking for ways to learn html (and I soon realized, CSS by default).

I found CodeAcademy. This site is like a programming languages site for dummies. Once I started their “lessons” I was hooked. A lot of it was a bit redundant from our lesson with David Birnbaum. CSS is used to style the html document, they’re formatted similarly, but their languages are OH so different.

It’s like looking at Spanish and Portugese. They look similar, are formatted similarly, but are totally different languages. You can kind of understand one if you know the other, but try writing it…nope makes no sense!

However, I’m super grateful for having played with both CSS and XML beforehand. it made understanding html a bit easier.

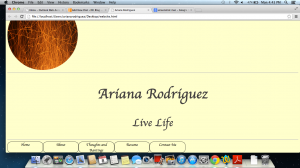
What I have created so far.

What I have created so far.

So here I am, done with the html/CSS lessons from CodeAcademy, and I now have this rudimentary understanding of html and how to format the building blocks of a website.